Current Release (2025)
The most recently available deprivation data are from the 2025 English Indices of Deprivation. These show relative deprivation at small areas (LSOAs). Data on household deprivation comes from the 2021 census and can be found in the census demographics section of the JSNA website.
The Indices of Deprivation are an area-based measure of relative levels of deprivation in small areas, (Lower Super Output Areas (LSOAs), which contain approximately 1,500 people). It can be used to compare the deprivation across different areas, identify the most deprived areas within a larger geography (for example in the CCG), and to examine which domains of deprivation are more or less prominent in an area. The Indices cannot be used to quantify how deprived an area is (nor can it say by how much one area is more deprived than another), and there are different indices of deprivation for Wales, Scotland and Northern Ireland (so comparisons cannot be made across countries).
The indices are published by the Ministry for Communities, Housing, and Local Government every 3-4 years and are widely used, notably in funding allocations and targeting. The most recent update is the ID2025, released in October 2025. ID2025 is made up of seven domains of deprivation, although each domain is not given equal weighting. From these, an overall score of small area deprivation is calculated; these are then ranked from most deprived (1) to least deprived (33,755). It is important to note that the indices measure deprivation and not affluence (the least deprived area may not necessarily be the most affluent).
Domains contributing1 to the overall Index of multiple deprivation:
- Income (22.5%)
- Employment (22.5%)
- Health Deprivation and Disability (13.5%)
- Education, Skills and Training (13.5%)
- Crime (9.3%)
- Barriers to Housing and Services (9.3%)
- Living Environment (9.3%)
In addition to the seven domain-level indices above, there are 2 supplementary indices: the Income Deprivation Affecting Children Index (IDACI) and the Income Deprivation Affecting Older People Index (IDAOPI). These are created as subsets from the Income Deprivation domain.
Briefing and further information
Further information about West Sussex and the 2025 IMD can be found in our update briefing.
Past Releases
2019 Indices of Multiple Deprivation
Please note that due to changes in underlying geographies, this archive should be used for understanding data that were created around the time of the release. Care should be taken when making comparisons across releases.
Click here for the West Sussex 2019 IMD briefing.
2019 Map
The map below summarises the 2019 IMD rankings for LSOAs in West Sussex. You can also toggle between the different subdomains.
If you cannot see the map, please click on this link and use the back button of your browser to return to this page.
2015 Release
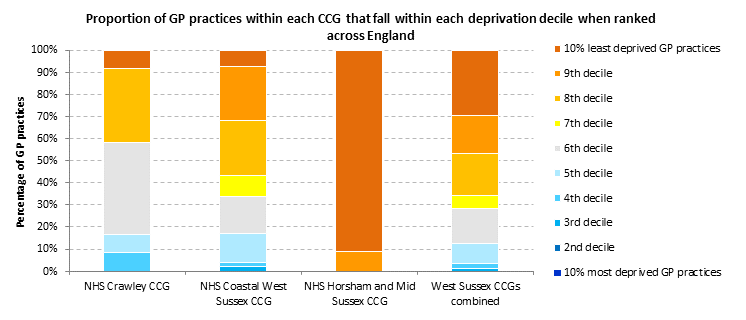
Indices of multiple deprivation at GP practice level (2015)
GP practices do not have established geographical boundaries (e.g. people residing in one area may be registered to GP practices outside of their local area and more than one GP practice may operate in a single area). However, using the January 2016 release of residential location of GP registered patients, it is possible to create a deprivation score for each GP practice ‘reach’.
The GP Practice deprivation score is the registered population (as at 31st December 2015) weighted by ID2015 score, as a proportion of the total population registered to the GP. This is calculated by taking the deprivation score for every LSOA where a GP has registrations multiplied by the number of registrations for the GP in that LSOA and dividing this total by the number of people registered to the GP.

Population weighted (using Jan 2016 HSCIC release) ID2015 deprivation score
The table below shows the number of practices in each deprivation decile for West Sussex CCGs.
| Deciles | NHS Crawley CCG | NHS Coastal West Sussex CCG | NHS Horsham and Mid Sussex CCG | All West Sussex GPs |
|---|---|---|---|---|
| 10% most deprived GP practices (ID 2015) | 0 | 0 | 0 | 0 |
| 2nd decile | 0 | 0 | 0 | 0 |
| 3rd decile | 0 | 1 | 0 | 1 |
| 4th decile | 1 | 1 | 0 | 2 |
| 5th decile | 1 | 7 | 0 | 8 |
| 6th decile | 5 | 9 | 0 | 14 |
| 7th decile | 0 | 5 | 0 | 5 |
| 8th decile | 4 | 13 | 0 | 17 |
| 9th decile | 0 | 13 | 2 | 15 |
| 10% least deprived GP practices | 1 | 4 | 21 | 26 |
| Total number of practices | 12 | 53 | 23 | 88 |
Please note: we are currently updating the West Sussex JSNA site so please check back soon for updates.
-
The figures shown in brackets are weights for how much each domain contributes to the overall score. ↩