Population estimates
Annual estimates of the population living in West Sussex are provided for a range of geographies (e.g. output area, ward, district, CCG, county, region, and country). National and local authority estimates are usually updated in June each year by the Office for National Statistics for the previous year (e.g. mid-2016 estimates were released in June 2017), with small area population estimates released later in the year, usually in November.
Population Estimates 2016 Briefing (PDF, 0.3Mb). This short pdf summarises the 2016 population estimates. More detail can be read below:
In 2016 843,765 people were estimated to be resident in West Sussex. This was 7,509 more than in 2015, an increase of approximately 0.9%. There were 8,953 births and 8,915 deaths and net internal migration (from/to elsewhere in the UK) was 4,968, slightly down from 5,541 in 2015. Net international migration in West Sussex, in 2016, was 2,435, similar to 2015 (2,440). This means that population increase resulted largely from net internal migration.
Age structure in West Sussex
The median age provides a useful summary measure of the age structure of the population as it shows that exactly half the population is below and the other half is above the median age. In West Sussex, the median age in 2016 was 44.7 years, up from 44.5 years in 2015 and 42.4 years in 2006.
The figure below shows that for most districts, the median age has increased over the last decade although there is more fluctuation in Crawley district. Moreover, Crawley has consistently maintained a lower median age for its population compared to the rest of the county. In 2016, the median age for residents in Crawley was 36.6 years compared to Arun which had a median age of 48.9 years.
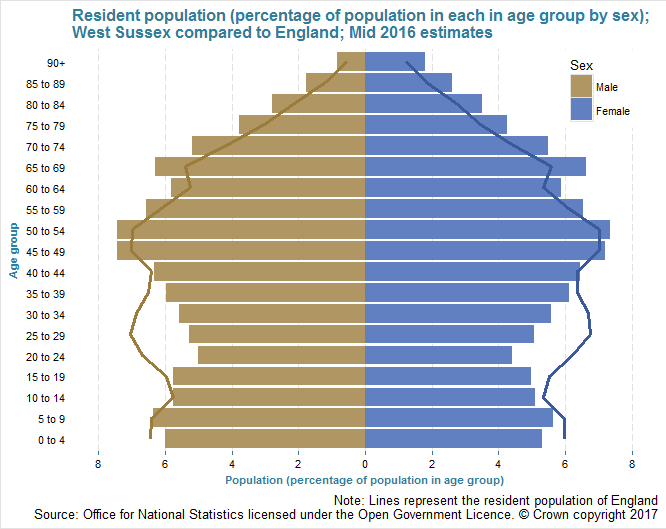
The West Sussex population by age band and sex compared to England is presented in the population pyramid below. The figure shows that West Sussex has a considerably older age profile compared to England with higher proportion of over 65s and relatively fewer residents aged 15-39.

Internal Migration
The chart below shows the net internal migration flow for West Sussex in the year ending June 2016 by age group. It shows that over the 12 months leading to June 2016, more people settled in the county than left for nearly all age groups apart from 15-19 and 20-24 year olds. These young people may be those who leave the family home for the first time to go to university.
The pattern of net internal migration is varied among the districts of West Sussex (shown below), with Crawley showing the inverse of the pattern seen at county level, with 20-24 year olds being the only age group to have a net increase in population.
District population change
The population increased in all districts between 2015 and 2016; the highest percentage increase was in Horsham (1.6%), the lowest in Adur (0.1%). The chart below shows the percentage change between each year by district from 2001 to 2016. It shows that there has been an increase in population each year for every district since 2006, although the percentage increase varies over time and district.
Population density
The mid year population estimates show us how many people live per square kilometre, as a measure of population density (how many people share a unit of space). In West Sussex, in 2016, there was estimated to be 424 people per square kilometre. There is variation across the county with Chichester having as few as 150 residents per square kilometre and Worthing having more than twenty times this at 3,291 residents per square kilometre. The figure below shows how the population density of West Sussex districts has been fairly stable over the last 15 years.
Downloads
West Sussex District Population Profile 2014 and 2015
Date added: 01/02/2017
Population tables for West Sussex Districts.
West Sussex District Population Profile 2014 and 2015, Excel Spreadsheet.
West Sussex CCG Population Profile
Date added: 01/02/2017
Population tables for West Sussex Clinical Commissioning Groups.
Please note: we are currently updating the West Sussex JSNA site so please check back soon for updates.